Introduction
For managing and enhancing your system, Linux includes a variety of built-in utilities. To make the most of Linux when you’re a newbie to it or decided to switch from Windows, you’ll now have to learn a few commands. Linux is best known as an extremely user- or administrator-friendly operating system. No matter what version of Linux you use—Ubuntu, Mint, Debian, or another—you can accomplish anything with the appropriate tools and instructions.
We’ll concentrate on how to monitor the memory use on Linux in this post because it’s an essential skill to know.
All necessary information is accessible and can get tracked down with a few easy terminal commands. Learn five effective Linux commands in this guide to check your system’s memory use.
Commands to Check Memory Use in Linux

Linux Memory Details Displayed by the Cat Command
You could access the /proc/meminfo file by typing cat /proc/meminfo on your terminal.

The quantity of available and utilized RAM gets reported by this virtual file. The kernel’s use of shared memory and buffers, along with the system’s memory utilization in real time, are all covered. Depending on the structure and system software in use, the outcome could change slightly.
With Ubuntu 18.04, the /proc/meminfo file appears like this for an example:
The data get shown on the terminal in kilobytes.
Free Command to See the Physical as well as Swap Memory Capacity
This is what happens when you type “free” on your command terminal:
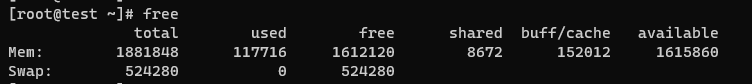
In kilobytes, the data shows the amounts of swap memory that get consumed and accessible.
| total | the total amount of installed memory |
| used | Now active processes’ consumption of memory (used = total – free – buff/cache) |
| free | Memory that has not getting utilized (free = total – used – buff/cache) |
| shared | several processes share the same memory |
| buffers | Memory is set aside by the System for allocating as buffers when processes require them |
| cached | RAM-based storage for recently used files |
| buff/cache | Cache plus buffers |
| available | a calculation of the amount of memory that is available for fresh application startup without swapping. |
The free command offers far less information than the /proc/meminfo file. But it is simpler to comprehend. The important number is the available value, which shows how much RAM is still accessible for freshly developed applications to run.
To format the result to better meet your needs, the free command offers a wide range of options. The most practical free command variants get listed in the table below.
| Options | Outcome |
| -b | display in bytes |
| -k | display in kibibytes |
| -m | produced in megabytes |
| -g | produced in gibibytes |
| -l | in-depth data on both high and low memory |
| -o | outdated format (no line for -/+buffers/cache) |
| -t | total RAM + swap |
| -s | synchronize every [delay] second |
| -c | update [count] times |
It is crucial to keep in mind that: Trying to enter man free, like with other commands, provides a list of all possible versions and explanations of the outcomes.
Reporting Virtual Memory Information with the Vmstat Command

A helpful tool for reporting virtual memory statistics would be the vmstat command.
A broad overview of processes, storage, paging, blocks IO, traps, as well as CPU activity gets provided by vmstat.
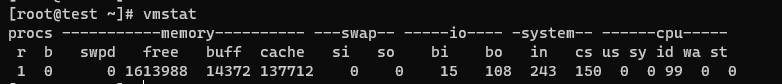
If you require assistance in understanding the outcomes, refer to the thorough description mentioned below, which explains every value.
Procs
- r: the number of processes awaiting execution.
- B: The number of uninterrupted sleep processes.
Memory
- Virtual memory usage got reported by SWPD.
- free: the proportion of memory that isn’t getting used.
- buff: The total space allocated for buffers.
- cache: The total memory capacity used for cache.
Swap
- si: Memory got switched in from the disc (/s).
- So: switched to disc from memory (/s).
IO
- bi: The number of blocks (blocks/s) that got collected from a block device.
- b: The number of blocks transferred per second to a block device.
System
- in: the number of interruptions per sec, along with the clock.
- cs: the quantity of context flips per sec.
These Percentages Represent the Overall Amount of CPU Time.
- us: Time used for non-kernel code execution. (User time, nice time included)
- sy: The length of time spent working kernel code. (Time on the system)
- id: Length of downtime. This contains IO-wait time up until Linux 2.5.41.
- wa: The period spent holding out for IO. Formerly incorporated into idle in Linux 2.5.41.
- st: Time snatched from a virtual computer. Not known before Linux 2.6.11.
Top Command to Examine Memory Usage
For examining memory and CPU utilization by process, the top command is helpful. It provides details about:
- uptime
- standard load
- operating tasks
- amount of users who have logged in
- CPU utilization/number of CPUs
- Memory/system process swap

You can track the procedures in real time because the information gets modified consistently.
The top command offers a constrained interactive interface in addition to giving you significant memory information. With command-line parameters, it is possible to modify and customize operations.
A complete list of all accessible variants gets provided by the man command in Linux man top.
Finding Each Process’s Memory Load with the htop Command
Similar data get presented by the top command as well as the htop command. The htop command’s user-friendly interface and enhanced controls, meanwhile, are its genuine benefits.

The command supports both vertical as well as horizontal scrolling, incorporates color for its output, also offers complete command lines for processes.
- htop
The following result gets displayed:
- The top section comprises text counters and graphic meters that display summary data.
- The detailed data get organized per process in the lower portion. You can easily take action on particular processes according to this.
- You could rapidly manage and adjust the processes using the shortcuts provided at the bottom of the screen without having to enter precise commands.
It is important to keep in mind that you must install the htop functions first if you encounter the “Command ‘htop’ not found” error while attempting to run the htop command:
sudo snap install htop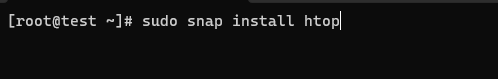
Use the following command as an effective solution:
sudo apt install htop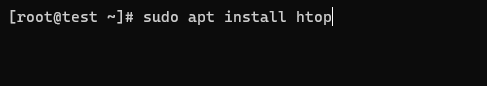
Checking Memory Usage in Linux using the GUI

A graphical interface is not typically used for server administration. Yet, other data sets are far more understandable and provide a visual display of memory utilization.
- a System Monitor can get accessed by:
- Choose Display Applications from the menu.
- Open the application by typing System Monitor into the search box.
- Pick out the Resources tab.
- The display provides a real-time, graphical breakdown of your memory usage, along with historical data.


Also Read: How to Update Git Version on Linux, Windows, Mac?
Conclusion
Many choices got presented in this article for you to examine your Linux system’s memory consumption. We discovered that a single command generates a significant amount of insightful data for project undertaking. It’s important to learn the proper way to understand the data.
You could now manage your server better and more effectively.